Dynamic Visualization of the Number of Covid-19 Cases in Top 10 Countries Throughout the Time
Description
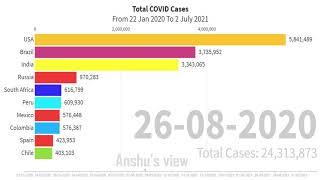
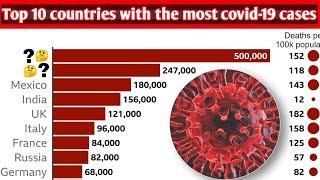
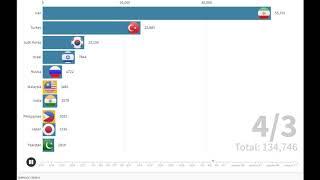
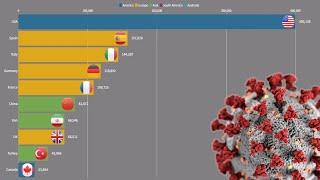
This video shows a dynamic visualization of the number of covid 19 cases in top 10 countries throughout the time period from 01/01/2020 to 13/04/2020. The top 10 countries are USA, Spain, Italy, Germany, France, UK, China, Iran, Turkey, and Belgium.
Data source: ECDC
Free music from YouTube audio library.
Thank you for watching - I really appreciate it :)
⚑ ABOUT MY CHANNEL ⚑
This channel is a collection of great ideas and philosophies that can improve your life. More specifically, this channel is designed to help people solve various problems in personal development, well-being, technical issues, academic success, business, and learning English/French.
⚑ SUBSCRIBE TO MY CHANNEL TO RECEIVE MANY NEW USEFUL VIDEOS ⚑
https://www.youtube.com/c/LEARNWITHPANDA?sub_confirmation=1
My website: https://learnwithpanda.com
My facebook: https://www.facebook.com/LearnWithPanda
All of my videos on YouTube: #LearnWithPanda
© Copyright by LEARN WITH PANDA. ☞ Do not Reup


Comments