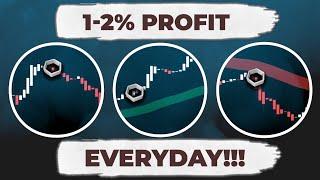
Spinning top on the daily chart for 10-yr notes. Standard candle called the Heikin-Ashi candle
Description
Here's a quick run through the action in Treasuries today. Interesting to note the daily candle for 10-yr notes formed a bit of a spinning top on Friday. That was for a standard daily candle. Now flip to a daily Heikin-Ashi chart and you'll see that spinning top appeared today. Great example of how Heikin-Ashi charts blend in data from the previous interval.
What does this mean? I'd be cautious initiating longs as the market may be tuned to reverse. More consideration would be give to playing from the short side vs. the long side.
#shorts #treasuries #bonds #notes #technicalanalysis #charts #candlesticks
Please subscribe to this channel and click the bell for updates.
I use the TT platform from Trading Technologies.
Read more about their drag and drop algo dev tool, ADL, here: https://www.tradingtechnologies.com/t...
Sign up for a free 30-day trial of the TT platform here: https://www.tradingtechnologies.com/t...
Find me on Twitter: https://twitter.com/patrickrooney
Find me on LinkedIn: https://www.linkedin.com/in/patrickjrooney/
Find me on Instagram: https://www.instagram.com/futures_trader/


Comments