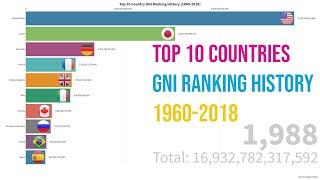
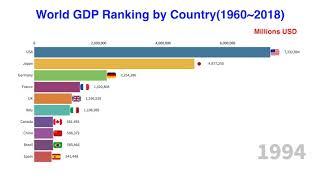
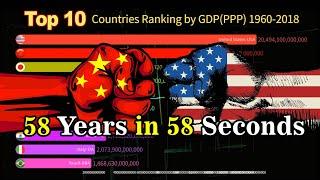
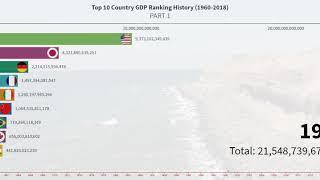
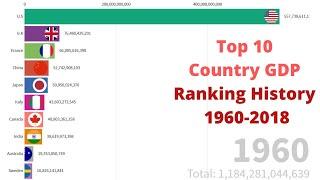
Top 10 Country GDP Ranking (1960 - 2018) World Bank Version
Description
Top 10 Country GDP Ranking (1960 - 2018) World Bank Version ,
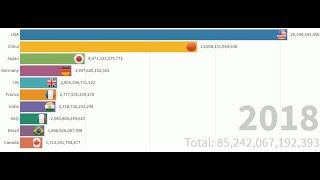
The different phases of economic cycles toss economies around the world. However, it’s interesting to see that these top economies don't budge easily from the positions they hold. When compared to the top 20 economies of 1980, 17 are still present on the list, which means only three new entrants.
In addition to the key players remaining almost the same, this analysis reveals these economies are the engine of growth, commanding a majority of the global wealth. The nominal GDP of the top 10 economies adds up to about 66% of the world's economy, while the top 20 economies contribute almost 79%. The remaining 173 countries together constitute less than one-fourth to the world's economy.
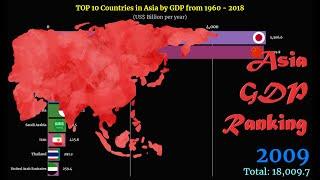
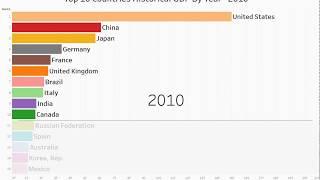
Nominal GDP = Gross domestic product, current prices, U.S. dollars
GDP based on PPP = Gross domestic product, current prices, purchasing power parity, international dollars
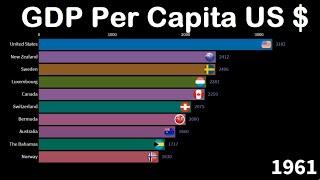
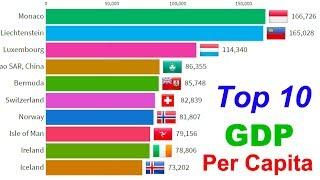
Gross domestic product per capita, current prices, U.S. dollars
Gross domestic product based on purchasing-power-parity (PPP) share of world total, percent





Comments