Top 10 World Death Rates By Country (1990-2017)
Description
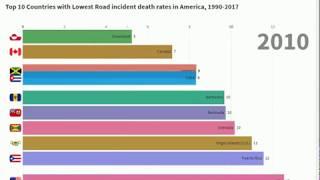
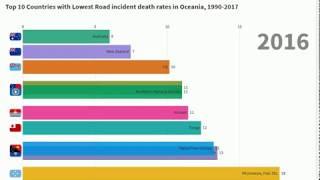
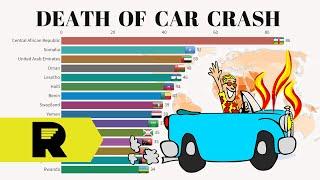
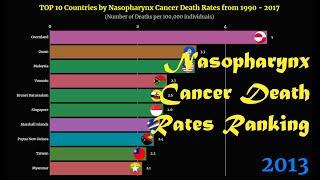
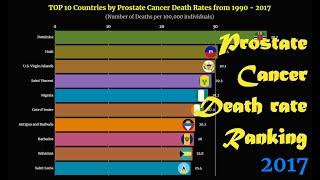
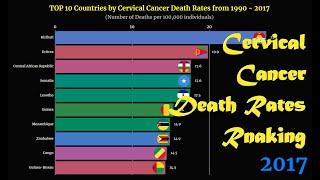
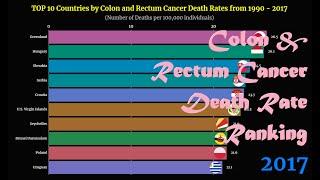
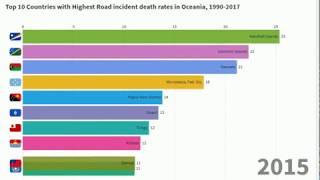
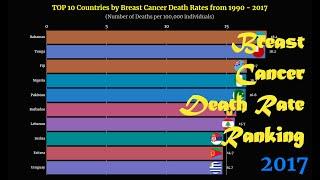
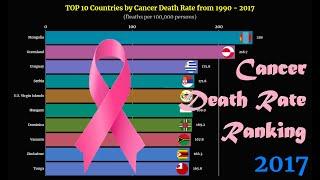
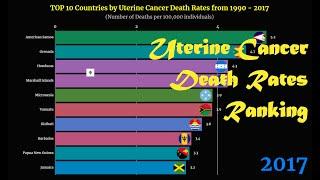
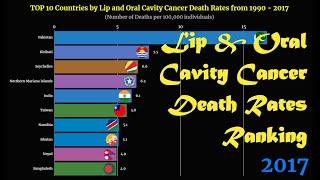
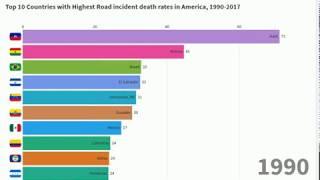
Timeline history of the top 10 death rate by Country by year from 1990 to 2017. In this data visualizations, total death rates are measured as the number of deaths per 100,000 individuals. Death rates have been age-standardized to assume a constant age structure of the population to compare between countries and over time. This racing bar chart video was inspired by watching Data is Beautiful videos.
Data source: IHME, Global Burden of Disease
-----
death rate,top 10,most dangerous places in the world,mortality rate,death,mortality,data visualization,top 10 country,ranking countries,animated stats,racing bar chart,charts,rankings,Global Burden of Disease,IHME,mortality rate by country,highest death rate in the world,death rate by country,data is beautiful,death ranking,world ranking,death rate by ocuntry,mortality rate by ocuntry,animated stats population





Comments