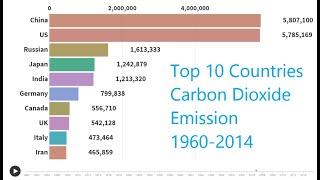
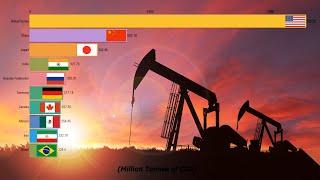
Top 15 Countries by Carbon Dioxide (CO2) Emissions 1960-2018: by Emissions & Emissions to GDP Ratio
Description
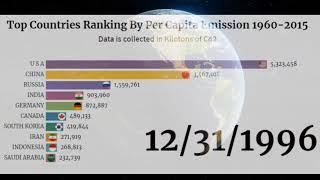
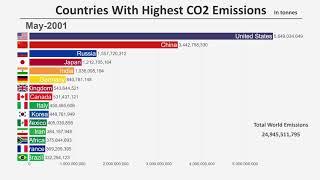
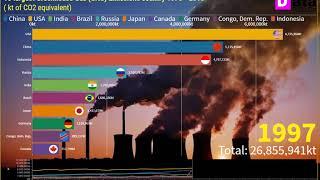
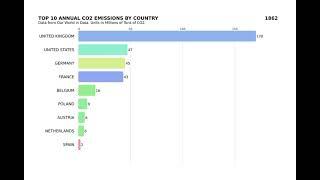
Top 15 Countries from 1960 to 2018 based on total carbon dioxide (CO2) emissions (million tonnes) and total carbon dioxide (CO2) emissions to GDP ratio (Kg per $ of GDP).
Total carbon dioxide (CO2) emissions are the carbon dioxide emissions attributed to the country in which they physically occur, which are decomposed based on five sources:
1. Carbon dioxide (CO2) emissions from the oxidation of coal.
2. Carbon dioxide (CO2) emissions from the oxidation of oil.
3. Carbon dioxide (CO2) emissions from the oxidation of gas.
4. Carbon dioxide (CO2) emissions from the combustion of vented natural gas and the venting of CO2 in the oil and gas industry converting methane into carbon dioxide.
5. Carbon dioxide (CO2) emissions from chemical reactions in the manufacture of cement.
Subscribe for future videos. https://bit.ly/2HkY1BU
Follow us on Twitter: https://twitter.com/numberstory2019
Reference:
1. Gilfillan et al. (2019): Global, Regional, and National Fossil-Fuel CO2 Emissions. CDIAC
2. UNFCCC (2019): National Inventory Submissions 2019. United Nations Framework Convention on Climate Change.
3. BP (2019): Statistical Review of World Energy.
4. World Bank
#CO2 #CarbonDioxide #GlobalWarming
Keywords: CO2, CO2 emissions, carbon dioxide, global warming, climate change, top countries, ranking, top 10, top 15, CO2 emissions by country, CO2 emissions explained, CO2 emissions graph, CO2 emissions per capita, CO2 emissions cars, CO2 emissions 2019, CO2 emissions by country 2019, CO2 emissions map, CO2 emissions video, carbon dioxide in the atmosphere, global warming short film, Greta Thunberg, climate change short film, carbon tax, Argentina, Australia, Belgium, Brazil, Canada, China, Denmark, France, Germany, India, Italy, Japan, Mexico, Netherlands, New Zealand, Norway, Rep. of Korea, Russian Federation, South Africa, Spain, Sweden, Switzerland, USA, United Kingdom





Comments